

See exactly where your money went — and what you kept
Open Statistics and your whole business comes into focus: cash collected, expenses, net profit, and unpaid balances — charted by month or year, calculated on a real cash basis your accountant will recognize. When tax time comes, hand them a clean two-file packet in a couple of taps.
Find your numbers
Statistics lives in the Business hub, not on a tab — so it stays out of your way until you want it. The Year-End Tax Report sits right beside it.
- Open the Menu and tap Business.
- Under Reports, tap Statistics.
- Read the four big number cards across the top.
- Tap Year-End Tax Report instead when you're ready to hand things off.
On open, the dashboard jumps to your most recent active year — so a quick look in January doesn't land you on an all-zeros current year and make it feel like the app lost your numbers.
Your four headline numbers
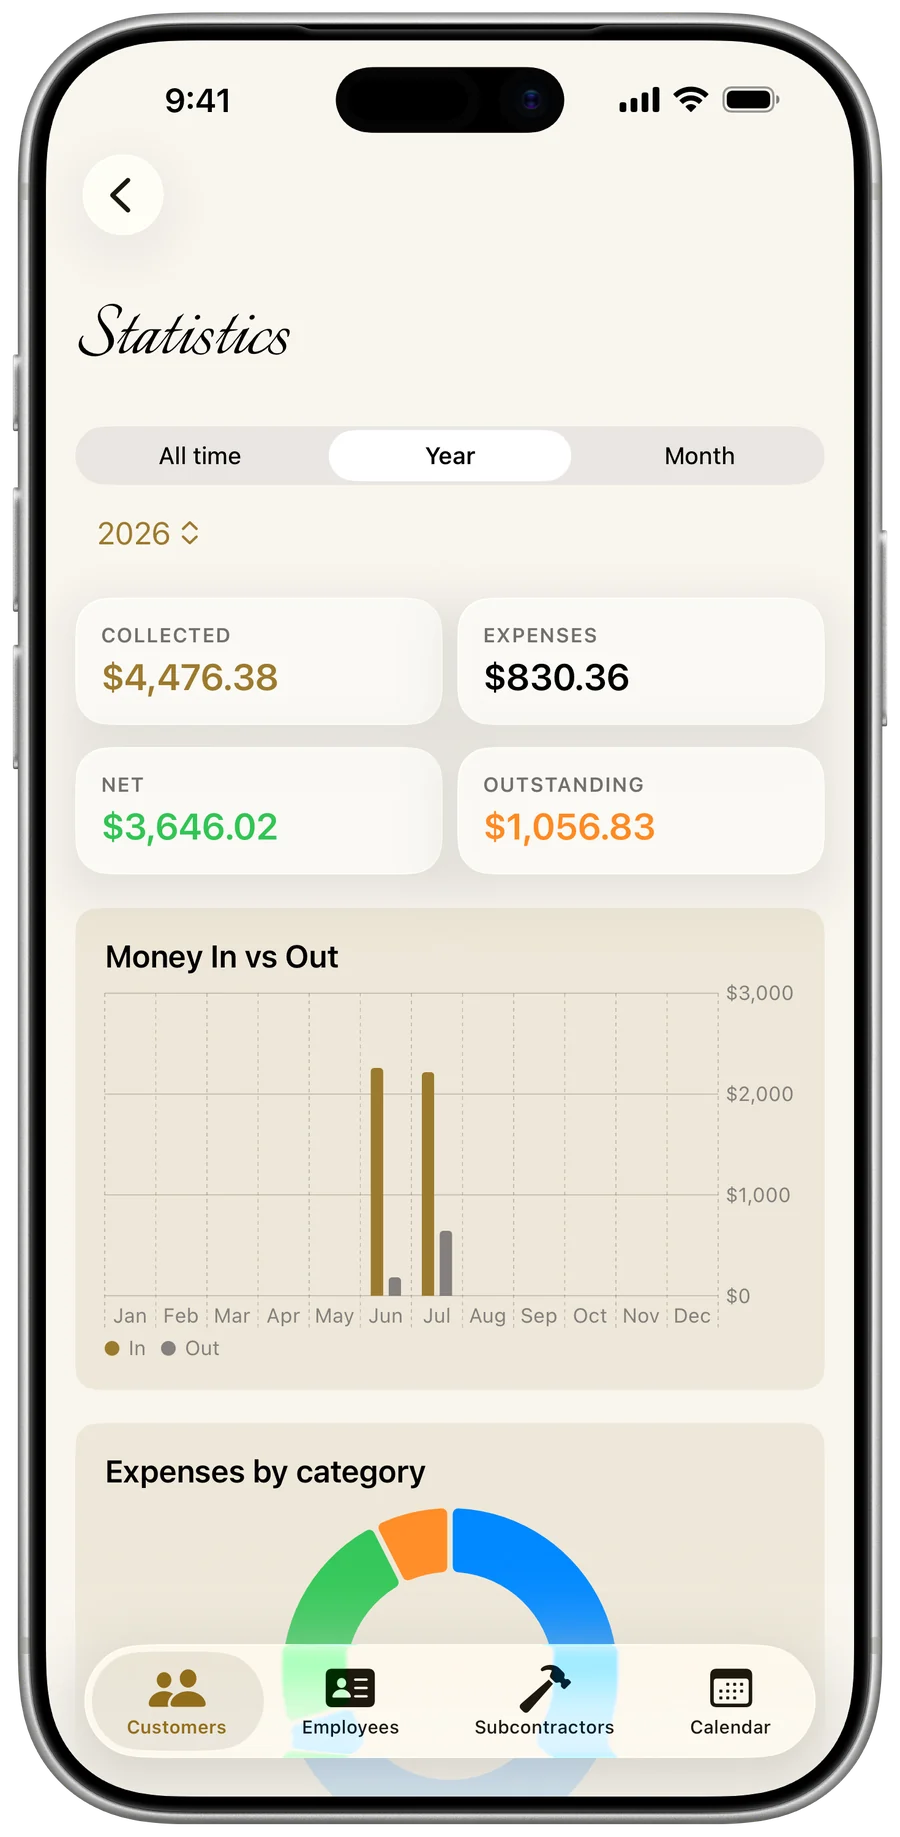
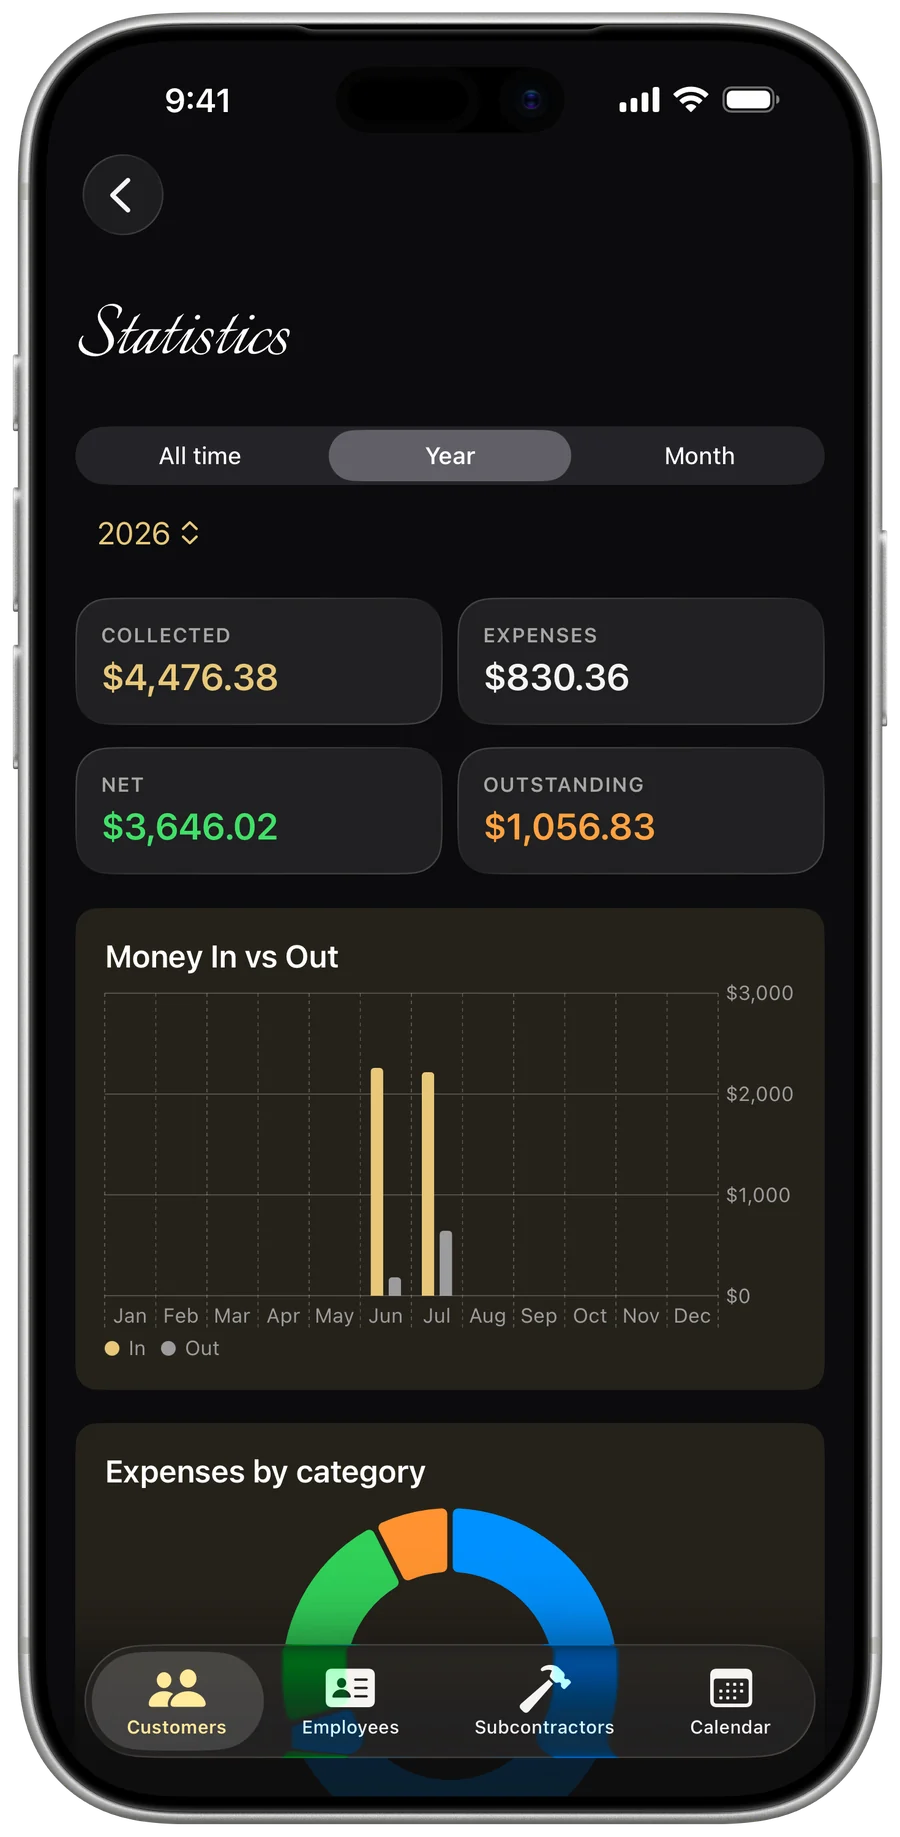
The top of the screen is a clean KPI grid — Collected, Expenses, Net, and Outstanding — color-coded so good and bad read at a glance. Every card respects the period you've selected.
- Collected — cash actually received in the period, tinted gold. This is real cash-basis income, not what you billed.
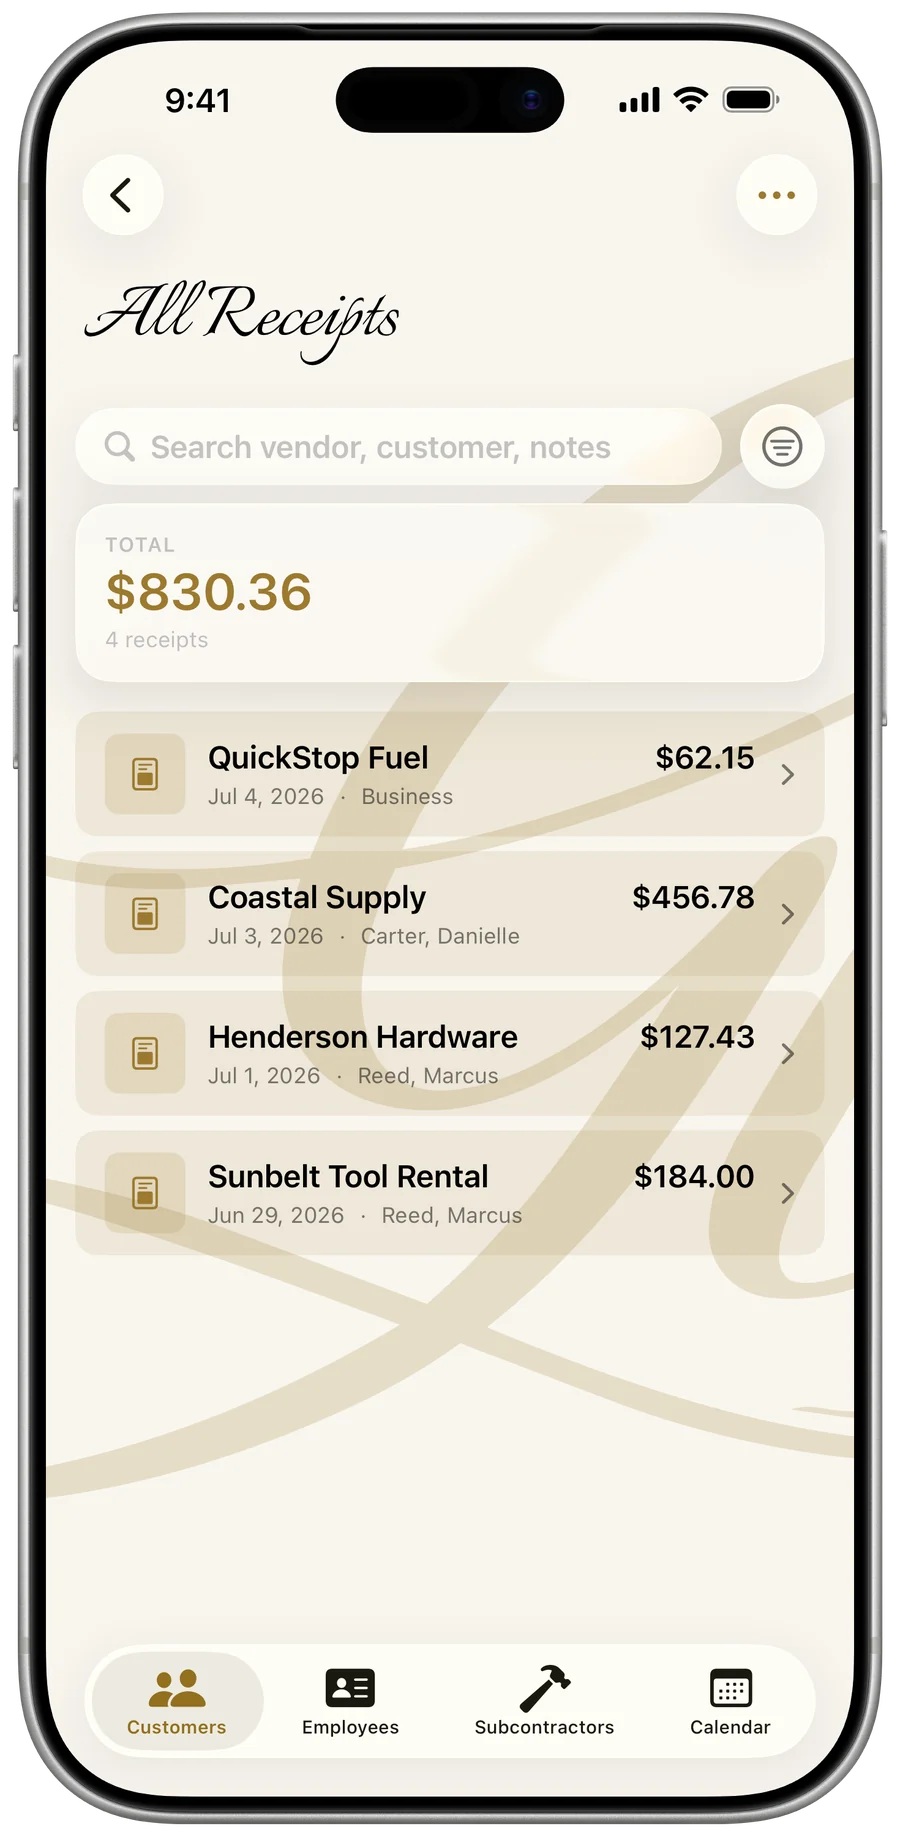
- Expenses — the total of every receipt dated in the period.
- Net — Collected minus Expenses minus processing fees; green when you're up, red when you're down.
- Outstanding — the unpaid balance on the period's invoices; orange when there's money owed, neutral at zero.
- Processing fees — a fifth card appears on its own only when payment-processor fees exist in the period.
Cash-basis math your accountant will recognize
Most apps just total your invoices and call it income. This one separates what you collected from what you billed, and Net subtracts both your expenses and any deductible payment-processing fees recorded on your payments — so the number you see is what you actually kept, done the way a cash-basis return is filed.
- Collected counts payments by the date they were received — money in hand, not money promised.
- Invoiced (shown on the tax report) counts what you billed, kept separate from what came in.
- Net = Collected − Expenses − processing fees, so any recorded processor cut never quietly inflates your profit.
- When a payment recorded a processing fee, those deductible fees are broken out on their own line.
Rescope everything to all-time, a year, or a month
One period selector drives the entire screen. Pick a window and every card, chart, and total updates instantly to match.
- On the Statistics screen, find the segmented control near the top.
- Tap All time, Year, or Month.
- For Year or Month, pick the year from the gold Year menu.
- For Month, also pick the month from the gold Month menu.
- All time — every transaction you've ever recorded.
- Year — any year with activity, plus the current year and your last pick are always offered.
- Month — choose a year and any of the twelve months.
- The year menu is built from years that actually have invoices, estimates, receipts, or payments, newest first.
Money in vs money out, on a chart
A grouped bar chart puts income up against expenses-plus-fees so the shape of your cash flow is obvious. Gold bars are money in; gray bars are money out. Change the period and the chart rebuckets itself.
- Year view — one in/out pair per month, January through December.
- All-time view — one in/out pair per year that has activity.
- Month view — a single in/out pair for that month.
- Money in is payments received; money out is receipt totals plus payment-processing fees.
- The dollar axis is formatted as whole-dollar USD.
Where the spending actually went
An Expenses by category donut shows where the period's receipts landed, with a labeled list underneath sorted biggest spend first — so the categories quietly eating your margin are right at the top.
- Categories come straight from the category you set on each receipt.
- Receipts you left blank are grouped under Uncategorized.
- Each category row shows its USD total alongside its slice.
- No receipts in the window? The card simply says so instead of showing an empty ring.
Estimate win rate and invoice performance
The Estimates & Invoices card turns your quoting into a number. It reports what you quoted, how many estimates you won versus lost, your win rate, and how your invoices are performing — a free sales-conversion metric most contractor apps never bother to show you.
- Estimates quoted — total dollar value of estimates created in the period.
- Accepted / declined — head-to-head counts; pending, draft, and sent estimates count as neither.
- Win rate — accepted ÷ decided, shown as a whole percentage, and hidden until at least one estimate has been decided.
- Invoices — count created in the period, plus the average invoice value.
- Overdue — a count in orange when invoices are past due, and hidden when none are.
Hand your accountant a clean year-end packet
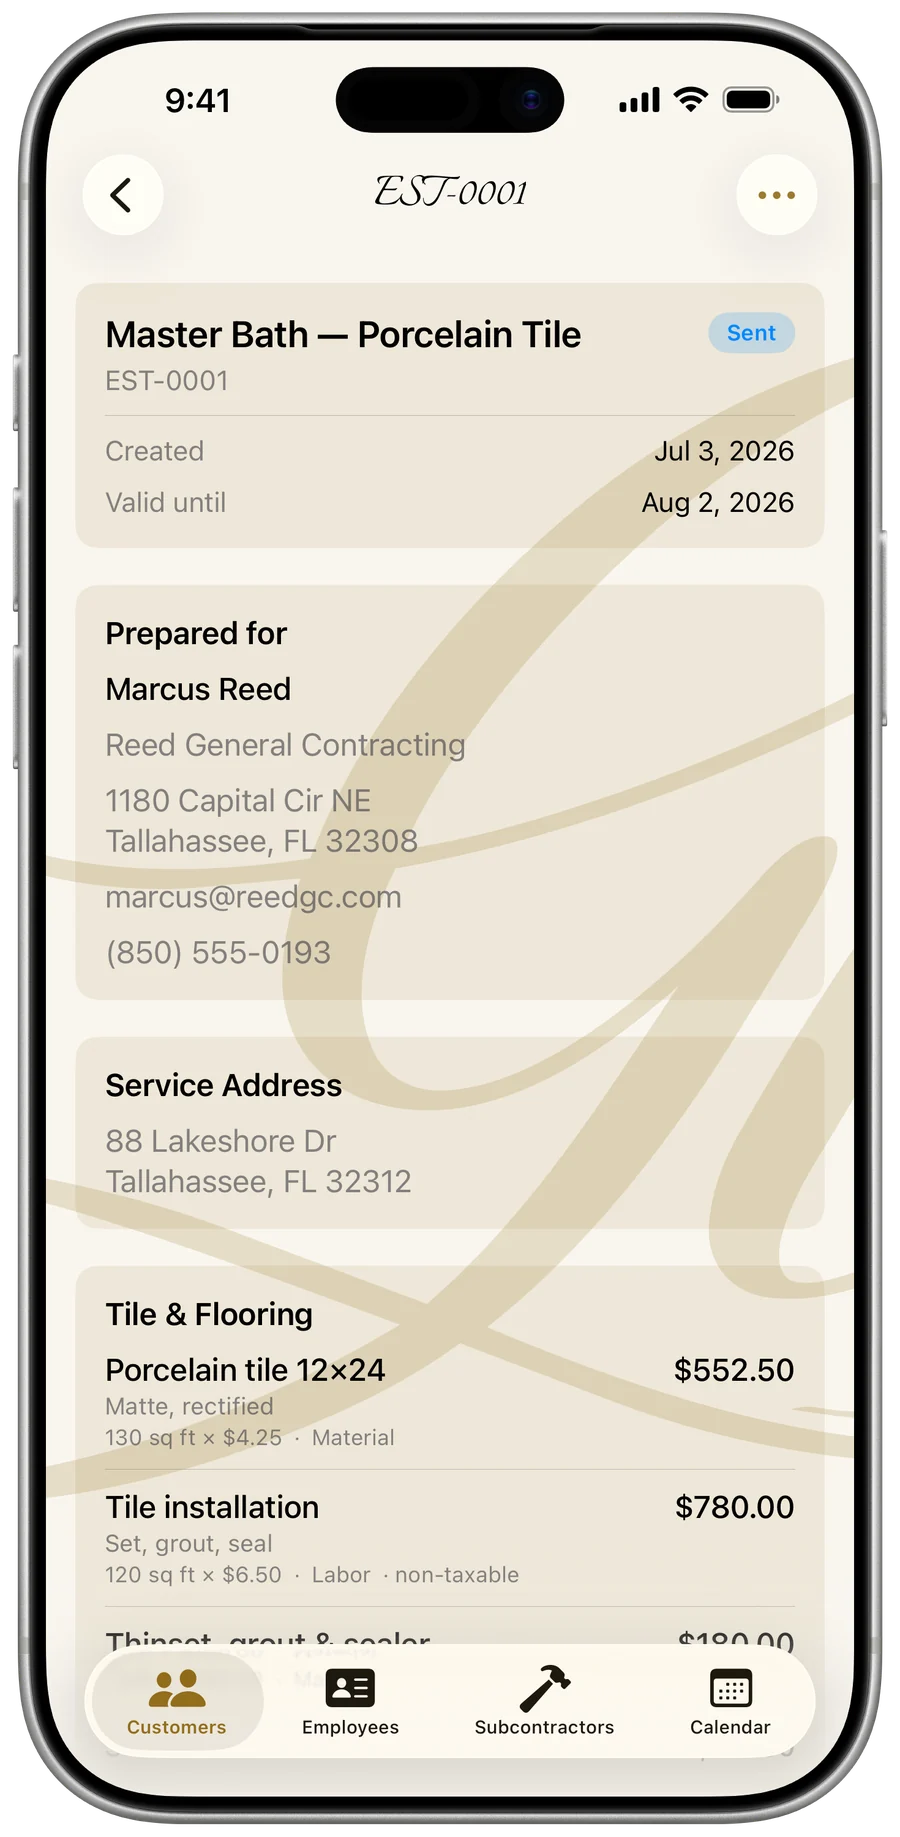
The Year-End Tax Report is a real two-file handoff, not a screenshot. You get a readable summary and a complete receipts spreadsheet for the year — with a paper-style preview so you see exactly what you're sending before it leaves your phone.
- From the Menu, tap Business, then under Reports tap Year-End Tax Report.
- Review the white paper preview — income, expenses by category, total expenses, and net.
- In Tax year, pick the year to cover (it defaults to the last completed year).
- Tap the share icon in the top-right.
- Send both files by Mail, Messages, or AirDrop — or save them and hand them over.
- Summary .txt — business name, period, Income (collected, invoiced, sales tax, outstanding), expenses by category, total expenses, deductible processing fees when present, and Net.
- Receipts .csv — every receipt for the year with Date, Vendor, Category, Amount, Job (the customer name, or Business), and Notes.
- The CSV is written with a UTF-8 BOM, so it opens cleanly in Excel on Windows.
- The Job column maps each expense to a customer, so spending stays job-attributable.
- Files arrive named GL-Summary-<year>.txt and GL-Receipts-<year>.csv, with a pre-filled subject and a message signed in your business name.
The year-end outputs are a .txt summary and a .csv — there's no PDF export of the stats themselves. The plain formats are deliberate: they drop straight into any accountant's tools.
Nothing to show yet? That's fine too
On a brand-new business, the dashboard doesn't greet you with a wall of zeros. You get a friendly chart icon and a one-line explanation until there's something real to chart.
- The empty state appears automatically when you have no invoices, estimates, or receipts.
- Add your first estimate, invoice, or receipt and the full KPI grid and charts take over instantly.